Windows Overlays Window <Prev Next>

Bitmap Overlay

This is the overlays window as shown when a bitmap overlay is selected. This is for use when the data to be overlaid is not available in numerical form, but only as an image, such as an illustration in a journal. Many of the buttons in the bitmap overlay window are the same as for the standard experimental overlay window, as described here.  However, unlike an experimental spectrum, a bitmap spectrum does not intrinsically contain a frequency scale.  It is therefore necessary to set the frequency scale manually by identifying two points on the spectrum with known frequency:
  1. For the first point, click the Xpixel 1 button, and then click on the point in the bitmap spectrum. Enter the corresponding frequency at Frequency1 in the grid.
  2. For the second point, click the X pixel 2 button, and then click on the point in the bitmap spectrum. Enter the corresponding frequency at Frequency2 in the grid.
  3. The Units may need changing; the default will be cm-1 but other units, including wavelength, can also be set in the settings grid to the right or bottom.
If you want to set the vertical scale:
  1. Click the baseline button and then click on a point on the baseline in the spectrum.
  2. Click the maximum button, and then click on a point on the highest point of the spectrum.
  3. If you need to change the vertical range produced (the default is 0 to 1) change the BaselineIntensity and MaximumIntensity values in the grid.

The status bar shows the position of the mouse in units of pixels. If a frequency scale has been set up as described above, it will also show the frequency.
OpenButton Load overlay file
SaveButton Save all overlays
SaveAsButton Save all overlays to different file
CopyButton Copy current overlay to clipboard
PasteOverlayButton Add another overlay from the clipboard
ActiveObject Select the active overlay
FixAllButton Fix all parameters
ConvertUnitsButton Cycle through units, converting parameter values. For overlays this is not normally required, as the the position units will be converted automatically to those selected for the main plot. Note also that in the overlays window the convert operation is applied to the currently selected object, not the entire tree of objects.
TreeView Displays all the loaded overlays; select the top item for settings that apply to all; right click on an item for additional item.
CommentPanel Display and edit a comment on the current overlay..

ParGrid 
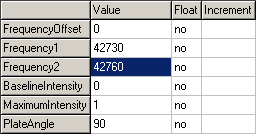
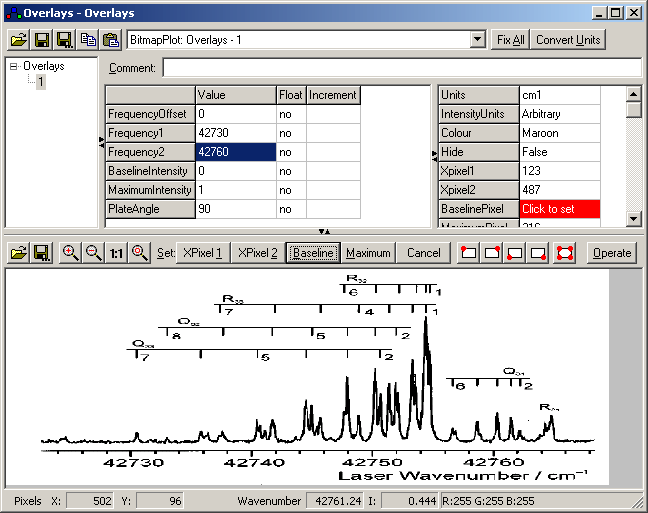
This is where the start and end frequencies, baseline and maximum intensities are set manually. See the top of the page for how to use these. A frequency offset can also be applied, if necessary.
OptGrid 
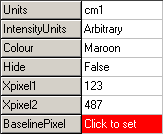
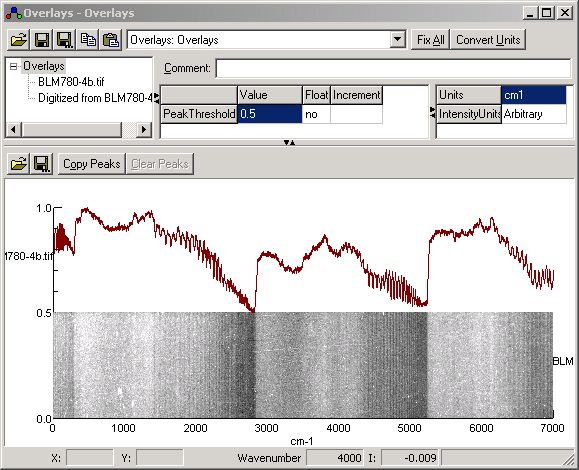
This sets the units for the horizontal and vertical scales, and allows the overlay to be optionally hidden on the main plot. (The colour is ignored for bitmap overlays.) The pixels corresponding to the calibration points in the grid above can be set manually here, though this is normally done with the mouse following the procedure at the top of the page. A red highlight indicates that the next click of the mouse in the plot window below will set that value.
AddOpenButton Add overlay from file
ExportCurrentButton Export current overlay to file
ZoomButton Show selected region only
ZoomOutButton Shrink plot
OneToOneButton Toggle display between fit to window and actual size
ResetZoomButton Reset plot zoom to fill window
Xpixel1Button Set point for Frequency 1 with the mouse
Xpixel2Button Set point for Frequency 2 with the mouse
BaselineButton Set baseline point with the mouse
MaximumButton Set maximum intensity point with the mouse
CancelButton Cancel setting points by mouse
TopLeftButton Set top left of region to trace
TopRightButton Set top right of region to trace
BottomLeftButton Set bottom left of region to trace
BottomRightButton Set bottom right of region to trace
AllCornersButton Set all four corners of region to trace
OperateButton Displays the additional options below.
Compact Compact bitmap by reducing to a single colour
Clear Peaks Delete peaks from this overlay
Crop Discard bitmap outside selected area
Plate Convert photographic plate spectrum to a conventional overlay, as shown in the example below. See Tracing Plate Spectra for more details
Plate Angle Measure angle of selected line on plate